Showing posts with label elections. Show all posts

2008-03-01

Poll: Coalition 23.2, Soc Dems 22.5, Centre 22.0

The Centre Party dropped to third in Taloustutkimus's latest poll (fi). The National Coalition Party lead for the third poll in a row, posting their third consecutive improvement. The Social Democratic Party were the biggest movers, though, gaining back the 0.9 percentage points they dropped the last time around. I would guess that this is closer to their true level of support than the previous result.

On the undercard, the Green League hit a ten poll high with 9.9 percent support. Christian Democrats are at a ten poll low with 4.0 percent.

CP   NCP  SDP  LA  GL   CD  SPP TF  gov  source
23.1 22.3 21.4 8.8 8.5 4.9 4.6 4.1 58.5 PE 3/18
...
22.3 23.6 21.2 8.5 9.4 4.6 4.5 4.7 59.8 TT 8/13
22.7 23.2 21.6 8.1 9.4 4.7 4.5 4.6 59.8 TT 9/9
22.5 22.6 21.5 8.4 9.0 4.6 4.6 5.0 58.7 TG 9/22
22.6 22.8 21.8 7.9 9.8 4.8 4.4 4.8 59.6 TT 10/13
22.6 21.7 21.7 8.6 9.1 4.6 4.7 5.1 58.1 TG 10/31
22.6 22.3 22.3 8.4 9.7 4.4 4.6 5.0 59.2 TT 11/19
22.3 21.5 22.3 8.6 9.4 4.6 4.6 4.9 57.8 TG 12/16
22.3 22.7 22.5 8.5 9.6 4.6 4.1 4.5 58.7 TT 12/21
22.5 22.9 21.6 8.4 9.8 4.7 4.3 4.7 59.5 TT 2/2
22.0 23.2 22.5 8.3 9.9 4.3 4.0 4.8 59.1 TT 3/1

Legend:
CP = Centre Party
NCP = National Coalition Party
SDP = Social Democratic Party
LA = Left Alliance
GL = Green League
CD = Christian Democrats
SPP = Swedish People's Party
TF = True Finns
gov = government parties
PE = parliamentary election
TT = Taloustutkimus / YLE
TG = TNS Gallup / Helsingin Sanomat
RI = Research International Finland / MTV3

(I'm cutting the table to ten most recent polls or six months' worth of polls, whichever will provide more entries.)

2008-02-07

Counting votes

Hank W. is generally the best of the Finland for Thought crew when it comes to commenting on Finnish politics, but his post on election reform left something to be said.

There is a proposal into forming Finland into one or fewer electoral districts, mainly due to the fact that as the population has massed to the cities, the popular vote is valued differently in different district. So the vote of a person living in a small county weighs less than the vote of a person living in a populous city, thus conflicting the Constitutional principle of equality. Or say in the last elections Cronberg of the Greens didn't get into parliament from North Karelia (she is a minister though) even she had 8000 votes, while a True Finn Ruohonen-Lerner who got in from Porvoo with a mere thousand votes. Discrepancy? Maybe.

The number of MPs from an electoral district is proportional to the number of people living in the district, or at least about as close as it can be. This part of the system works pretty well. The real impetus for election reform is that some districts are now so small that their seats can't be divided between parties fairly. Parties need an unreasonably high percentage of the vote to elect even a single MP in low population districts, while in the big (and still growing) electoral districts a much smaller vote percentage is enough to win a seat.

As for Ruohonen-Lerner versus Cronberg, mentioning it doesn't make much sense in this context. The proposals mentioned in the media wouldn't do anything about the current open list system. Further, Cronberg was from a small district, received many votes, and wasn't elected; Ruohonen-Lerner was from a big district, received fewer votes, and was elected. This surely can't be used as an example of how votes cast in small districts count for more.

The real problem, and the one the reform is supposed to address, is the uneven way in which parties are treated in different sized districts. To use the previous case as an example, no Green League candidate was elected from Cronberg's district even though the party received 12 percent of the vote there, whereas True Finn party chair Timo Soini and Ruohonen-Lerner were both elected with six percent of the vote in their much more populous district.

2008-02-03

Election reform hits a snag

The Justice Ministry's election reform committee, which was intended to finish its work in late March, has reportedly hit a bit of a rough patch (fi). Anonymous sources have accused the big parties of obstructionism, so this week the Centre Party's secretary Jarmo Korhonen, a member of the committee, laid down (fi) his party's proposal. He that the big parties were prepared to change the system so that the whole of Finland constitutes a single electoral area and there's a four percent national electoral threshold. The Swedish People's Party, which benefits from its regionally concentrated support and is currently barely above the four percent threshold, obviously opposes (fi) such a move.

Of the micro-parties, the Senior Party and the Liberals issued a joint statement (fi) in which they approved of the plan for a single electoral area, but said that the threshold should be larger than four percent. Instead they would like to see a two-percent threshold - which, for what it's worth, is still so high that both of them put together would have a difficult time clearing it.

Looking at the last ten parliamentary elections, on average 6.9 parties have received more than four percent of the vote and 7.7 parties have gotten more than two percent. No parties have fallen between four and two percent in the last three elections, but in the six elections before that, one or two regularly did. Fear of fragmentation is hardly an issue unless we assume that these results would change drastically. Of the current established parties, the Christian Democrats and the Green League spent several elections below four percent back in the day, but had MPs anyway due to regional support and beneficial electoral alliances.

I kind of like the idea of a single national electoral area, but I agree that four percent is too high of a threshold. There's no particular reason why the limit shouldn't be two percent.

2008-02-02

Poll: Coalition 22.9, Centre 22.5, Soc Dems 21.6

Taloustutkimus's latest party support poll, the first of 2008, is out (fi). It must be considered good news for the government parties, which have all increased their support by a few percentage points. The Social Democratic Party was the big loser, dropping 0.9 percentage points, but it's not all bad news for SDP. The polling was conducted between January 8th and January 31st and YLE reports that during that time the Social Democrats' support increased, whereas the Centre Party lost support. Is it the Kemijärvi effect?

CP   NCP  SDP  LA  GL   CD  SPP TF  gov  source
23.1 22.3 21.4 8.8 8.5 4.9 4.6 4.1 58.5 PE 3/18
23.0 24.1 20.7 8.2 9.4 4.5 4.4 4.5 60.9 TT 4/5
22.8 23.3 21.1 8.4 8.9 4.5 4.3 4.9 59.3 TG 5/20
23.4 23.3 20.8 9.0 9.6 5.0 4.1 4.4 60.4 RI 5/25
22.4 23.4 21.7 8.4 10.1 4.7 4.1 4.3 60.0 TT 6/9
23.0 23.2 21.5 8.3 9.0 4.3 4.2 5.0 59.4 TG 6/26
22.8 23.9 21.2 8.5 9.3 4.7 4.4 4.3 60.4 TT 7/2
22.3 23.6 21.2 8.5 9.4 4.6 4.5 4.7 59.8 TT 8/13
22.7 23.2 21.6 8.1 9.4 4.7 4.5 4.6 59.8 TT 9/9
22.5 22.6 21.5 8.4 9.0 4.6 4.6 5.0 58.7 TG 9/22
22.6 22.8 21.8 7.9 9.8 4.8 4.4 4.8 59.6 TT 10/13
22.6 21.7 21.7 8.6 9.1 4.6 4.7 5.1 58.1 TG 10/31
22.6 22.3 22.3 8.4 9.7 4.4 4.6 5.0 59.2 TT 11/19
22.3 21.5 22.3 8.6 9.4 4.6 4.6 4.9 57.8 TG 12/16
22.3 22.7 22.5 8.5 9.6 4.6 4.1 4.5 58.7 TT 12/21
22.5 22.9 21.6 8.4 9.8 4.7 4.3 4.7 59.5 TT 2/2

Legend:
CP = Centre Party
NCP = National Coalition Party
SDP = Social Democratic Party
LA = Left Alliance
GL = Green League
CD = Christian Democrats
SPP = Swedish People's Party
TF = True Finns
gov = government parties
PE = parliamentary election
TT = Taloustutkimus / YLE
TG = TNS Gallup / Helsingin Sanomat
RI = Research International Finland / MTV3

2007-12-21

Poll: Coalition 22.7, Soc Dems 22.5, Centre 22.3

YLE's latest poll (fi) inverts the top three positions from the previous one published by Helsingin Sanomat. By doing so, it breaks some patterns that have held for a long time. The Centre Party hasn't come in third since the summer of 2006. The National Coalition Party has been steadily losing support in every poll released since July, but now it gains a couple of percentage points.

The two frequent pollsters, TNS Gallup (doing work for HS) and Taloustutkimus (doing work for YLE), almost always support the same trends - e.g. at the moment both suggest that the Social Democratic Party has been gaining support - but notably there are distinct differences between their raw numbers for certain parties that persist over time. Taloustutkimus regularly measures higher support for the Coalition and the Green League, but lower support for the True Finns than TSN Gallup.

After the election Taloustutkimus in particular was accused, a bit unfairly, of consistently getting the Coalition's numbers too low. Now they're at the other end of the scale. Overcompensation, perhaps?

CP   NCP  SDP  LA  GL   CD  SPP TF  gov  source
23.1 22.3 21.4 8.8 8.5 4.9 4.6 4.1 58.5 PE 3/18
23.0 24.1 20.7 8.2 9.4 4.5 4.4 4.5 60.9 TT 4/5
22.8 23.3 21.1 8.4 8.9 4.5 4.3 4.9 59.3 TG 5/20
23.4 23.3 20.8 9.0 9.6 5.0 4.1 4.4 60.4 RI 5/25
22.4 23.4 21.7 8.4 10.1 4.7 4.1 4.3 60.0 TT 6/9
23.0 23.2 21.5 8.3 9.0 4.3 4.2 5.0 59.4 TG 6/26
22.8 23.9 21.2 8.5 9.3 4.7 4.4 4.3 60.4 TT 7/2
22.3 23.6 21.2 8.5 9.4 4.6 4.5 4.7 59.8 TT 8/13
22.7 23.2 21.6 8.1 9.4 4.7 4.5 4.6 59.8 TT 9/9
22.5 22.6 21.5 8.4 9.0 4.6 4.6 5.0 58.7 TG 9/22
22.6 22.8 21.8 7.9 9.8 4.8 4.4 4.8 59.6 TT 10/13
22.6 21.7 21.7 8.6 9.1 4.6 4.7 5.1 58.1 TG 10/31
22.6 22.3 22.3 8.4 9.7 4.4 4.6 5.0 59.2 TT 11/19
22.3 21.5 22.3 8.6 9.4 4.6 4.6 4.9 57.8 TG 12/16
22.3 22.7 22.5 8.5 9.6 4.6 4.1 4.5 58.7 TT 12/21

Legend:
CP = Centre Party
NCP = National Coalition Party
SDP = Social Democratic Party
LA = Left Alliance
GL = Green League
CD = Christian Democrats
SPP = Swedish People's Party
TF = True Finns
gov = government parties
PE = parliamentary election
TT = Taloustutkimus / YLE
TG = TNS Gallup / Helsingin Sanomat
RI = Research International Finland / MTV3

2007-12-16

Poll: Centre 22.3, Soc Dems 22.3, Coalition 21.5

Helsingin Sanomat published the first poll (fi) since before the election in which the National Coalition Party is in third place, dropping down to 21.5 percent. Meanwhile the Social Democratic Party and the Centre Party are tied for first at 22.3 percent. The Social Democrats are the biggest movers this time around, gaining 0.6 percentage points. Everyone else is within 0.3 percentage points of the previous poll.

Although the poll was released now, the first interviews for it were conducted in late November. As such, the nurses' pay row is one possible reason for the changes. Looking at the numbers, it seems to me that the government parties as a group started losing suppport in September. The public sector pay talks got underway in September and the Union of Health and Social Care Professionals (Tehy) rejected the initial municipal employers' offer at the end of that month.

CP   NCP  SDP  LA  GL   CD  SPP TF  gov  source
23.1 22.3 21.4 8.8 8.5 4.9 4.6 4.1 58.5 PE 3/18
23.0 24.1 20.7 8.2 9.4 4.5 4.4 4.5 60.9 TT 4/5
22.8 23.3 21.1 8.4 8.9 4.5 4.3 4.9 59.3 TG 5/20
23.4 23.3 20.8 9.0 9.6 5.0 4.1 4.4 60.4 RI 5/25
22.4 23.4 21.7 8.4 10.1 4.7 4.1 4.3 60.0 TT 6/9
23.0 23.2 21.5 8.3 9.0 4.3 4.2 5.0 59.4 TG 6/26
22.8 23.9 21.2 8.5 9.3 4.7 4.4 4.3 60.4 TT 7/2
22.3 23.6 21.2 8.5 9.4 4.6 4.5 4.7 59.8 TT 8/13
22.7 23.2 21.6 8.1 9.4 4.7 4.5 4.6 59.8 TT 9/9
22.5 22.6 21.5 8.4 9.0 4.6 4.6 5.0 58.7 TG 9/22
22.6 22.8 21.8 7.9 9.8 4.8 4.4 4.8 59.6 TT 10/13
22.6 21.7 21.7 8.6 9.1 4.6 4.7 5.1 58.1 TG 10/31
22.6 22.3 22.3 8.4 9.7 4.4 4.6 5.0 59.2 TT 11/19
22.3 21.5 22.3 8.6 9.4 4.6 4.6 4.9 57.8 TG 12/16

Legend:
CP = Centre Party
NCP = National Coalition Party
SDP = Social Democratic Party
LA = Left Alliance
GL = Green League
CD = Christian Democrats
SPP = Swedish People's Party
TF = True Finns
gov = government parties
PE = parliamentary election
TT = Taloustutkimus / YLE
TG = TNS Gallup / Helsingin Sanomat
RI = Research International Finland / MTV3

2007-12-03

In third grade, he wrote an essay titled 'I Want To Be a President'

This statement from the Hillary Clinton campaign, concerning Barack Obama's presidential aspirations, is gotcha politics at its very funniest.

"It was clear to me from the day I met him that he was thinking about politics," says a law school classmate.

How can any candidate recover from such a revelation?

2007-11-19

Poll: Centre 22.6, Coalition 22.3, Soc Dems 22.3

YLE published a Taloustutkimus party support poll (fi) today which supports the trends seen in the latest TNS Gallup poll. The Centre Party is back on top by virtue of holding steady while the National Coalition Party is losing support. The Social Democratic Party is pretty much tied for second and the Left Alliance seems to be on an upswing for a change.

It'll be interesting to see whether the government parties' fortunes will improve in post-nurses' pay dispute polls.

CP   NCP  SDP  LA  GL   CD  SPP TF  gov  source
23.1 22.3 21.4 8.8 8.5 4.9 4.6 4.1 58.5 PE 3/18
23.0 24.1 20.7 8.2 9.4 4.5 4.4 4.5 60.9 TT 4/5
22.8 23.3 21.1 8.4 8.9 4.5 4.3 4.9 59.3 TG 5/20
23.4 23.3 20.8 9.0 9.6 5.0 4.1 4.4 60.4 RI 5/25
22.4 23.4 21.7 8.4 10.1 4.7 4.1 4.3 60.0 TT 6/9
23.0 23.2 21.5 8.3 9.0 4.3 4.2 5.0 59.4 TG 6/26
22.8 23.9 21.2 8.5 9.3 4.7 4.4 4.3 60.4 TT 7/2
22.3 23.6 21.2 8.5 9.4 4.6 4.5 4.7 59.8 TT 8/13
22.7 23.2 21.6 8.1 9.4 4.7 4.5 4.6 59.8 TT 9/9
22.5 22.6 21.5 8.4 9.0 4.6 4.6 5.0 58.7 TG 9/22
22.6 22.8 21.8 7.9 9.8 4.8 4.4 4.8 59.6 TT 10/13
22.6 21.7 21.7 8.6 9.1 4.6 4.7 5.1 58.1 TG 10/31
22.6 22.3 22.3 8.4 9.7 4.4 4.6 5.0 59.2 TT 11/19

Legend:
CP = Centre Party
NCP = National Coalition Party
SDP = Social Democratic Party
LA = Left Alliance
GL = Green League
CD = Christian Democrats
SPP = Swedish People's Party
TF = True Finns
gov = government parties
PE = parliamentary election
TT = Taloustutkimus / YLE
TG = TNS Gallup / Helsingin Sanomat
RI = Research International Finland / MTV3

2007-11-04

More presidential polls

Re the presidential polls published in Apila, they've now come out with the numbers for the Centre Party (fi). As expected, Prime Minister Matti Vanhanen leads with 34% percent of support. He's followed by former Prime Minister Esko Aho and Jorma Ollila of Nokia fame, both at eigth percent, and then former (and future) Environment Minister Paula Lehtomäki and EU Commissar Olli Rehn at six percent. Anneli Jäätteenmäki MEP and Foreign Trade Minister Paavo Väyrynen are at four percent.

Interestingly, they also released some figures of where the candidates' support is coming from. Among Centrist, Vanhanen scored at 59 percent, Aho at 12 percent, Ollila at eight percent, Lehtomäki at seven percent, Rehn at three percent, Väyrynen at two percent, and Jäätteenmäki at one percent. I wouldn't have predicted that Väyrynen and Jäätteenmäki are less popular among Centrists than respondents as a whole. Conversely, Vanhanen and Aho are more popular among their own. Outside of Centrists, Aho is most popular among Christian Democrats and National Coalition Party supporters; Lehtomäki among Left Alliance and Green League supporters; Ollila among Social Democratic Party supporters and Greens; Väyrynen among True Finns supporters; Rehn among Coalitionists, Greens, and Social Democrats; and Jäätteenmäki among True Finns.

The Tampere daily Aamulehti published a poll (fi) on Social Democratic party council members' views. 38 out of 60 members responded and the winner was Governor of Bank of Finland Erkki Liikanen with 16% of first preference votes followed by former Prime Minister Paavo Lipponen at 11% - although Aamulehti asked the respondents to name three people and then gave points, which increased Liikanen's lead. Apparently the party council hasn't warmed up to Erkki Tuomioja MP. The respondents also backed party chair Eero Heinäluoma for another term; only five of them wished him to move aside next summer.

2007-10-31

Poll: Centre 22.6, Coalition 21.7, Soc Dems 21.7

The Centre Party is back at number one for the first time since the election in a new poll by TNS Gallup (fi). This is the seventh poll in a row which indicates a drop in support for the National Coalition Party, which is now tied for second with the Social Democratic Party. Behind the big three, the Green League and the True Finns are still doing rather well.

This is the first poll in which the government parties' combined support is below what it was in the parliamentary election. One suspects that the nurses may have something to do with it.

CP   NCP  SDP  LA  GL   CD  SPP TF  gov  source
23.1 22.3 21.4 8.8 8.5 4.9 4.6 4.1 58.5 PE 3/18
23.0 24.1 20.7 8.2 9.4 4.5 4.4 4.5 60.9 TT 4/5
22.8 23.3 21.1 8.4 8.9 4.5 4.3 4.9 59.3 TG 5/20
23.4 23.3 20.8 9.0 9.6 5.0 4.1 4.4 60.4 RI 5/25
22.4 23.4 21.7 8.4 10.1 4.7 4.1 4.3 60.0 TT 6/9
23.0 23.2 21.5 8.3 9.0 4.3 4.2 5.0 59.4 TG 6/26
22.8 23.9 21.2 8.5 9.3 4.7 4.4 4.3 60.4 TT 7/2
22.3 23.6 21.2 8.5 9.4 4.6 4.5 4.7 59.8 TT 8/13
22.7 23.2 21.6 8.1 9.4 4.7 4.5 4.6 59.8 TT 9/9
22.5 22.6 21.5 8.4 9.0 4.6 4.6 5.0 58.7 TG 9/22
22.6 22.8 21.8 7.9 9.8 4.8 4.4 4.8 59.6 TT 10/13
22.6 21.7 21.7 8.6 9.1 4.6 4.7 5.1 58.1 TG 10/31

Legend:
CP = Centre Party
NCP = National Coalition Party
SDP = Social Democratic Party
LA = Left Alliance
GL = Green League
CD = Christian Democrats
SPP = Swedish People's Party
TF = True Finns
gov = government parties
PE = parliamentary election
TT = Taloustutkimus / YLE
TG = TNS Gallup / Helsingin Sanomat
RI = Research International Finland / MTV3

2007-10-21

Black sheep with no guiding light

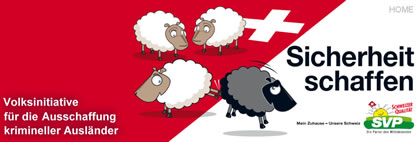
Because I know my readers come here primarily to find in-depth, sophisticated commentary on the major European elections, I'll say this: The Swiss People's Party's infamous sheep-themed election poster strikes me as badly designed. The black sheep appears so darned sad about being excluded and the white sheep show no emotion whatsoever. Who looks at this tableau and doesn't sympathize with the victim?

2007-10-13

Poll: Coalition 22.8, Centre 22.6, Soc Dems 21.8

According to a new Taloustutkimus poll (fi) published by YLE, the recent labor unrest hasn't led to any big chances in party support. Compared to last month, the National Coalition Party has lost and the Green League gained 0.4 percentage points - both government parties, of course. All other parties are within two tenths of a percentage point compared to the previous Taloustutkimus poll.

The government parties' support as a whole dropped 0.2 percentage points; it isn't much, but it's threatening to become a trend. In the opposition the Social Democratic Party has for a while now consistently polled above their parliamentary election result, but they're still stuck in third place.

CP   NCP  SDP  LA  GL   CD  SPP TF  gov  source
23.1 22.3 21.4 8.8 8.5 4.9 4.6 4.1 58.5 PE 3/18
23.0 24.1 20.7 8.2 9.4 4.5 4.4 4.5 60.9 TT 4/5
22.8 23.3 21.1 8.4 8.9 4.5 4.3 4.9 59.3 SG 5/20
23.4 23.3 20.8 9.0 9.6 5.0 4.1 4.4 60.4 RI 5/25
22.4 23.4 21.7 8.4 10.1 4.7 4.1 4.3 60.0 TT 6/9
23.0 23.2 21.5 8.3 9.0 4.3 4.2 5.0 59.4 SG 6/26
22.8 23.9 21.2 8.5 9.3 4.7 4.4 4.3 60.4 TT 7/2
22.3 23.6 21.2 8.5 9.4 4.6 4.5 4.7 59.8 TT 8/13
22.7 23.2 21.6 8.1 9.4 4.7 4.5 4.6 59.8 TT 9/9
22.5 22.6 21.5 8.4 9.0 4.6 4.6 5.0 58.7 SG 9/22
22.6 22.8 21.8 7.9 9.8 4.8 4.4 4.8 59.6 TT 10/13

Legend:
CP = Centre Party
NCP = National Coalition Party
SDP = Social Democratic Party
LA = Left Alliance
GL = Green League
CD = Christian Democrats
SPP = Swedish People's Party
TF = True Finns
gov = government parties
PE = parliamentary election
TT = Taloustutkimus / YLE
SG = Suomen Gallup (TNS-Gallup) / Helsingin Sanomat
RI = Research International Finland / MTV3

2007-09-22

This month's party support polls

Helsingin Sanomat published the latest poll (fi) from Suomen Gallup. The two big government parties, the National Coalition Party (22.6%) and the Centre Party (22.5%), have lost a little support, resulting in the worst combined support for government parties since the election. They're still barely ahead of their election day support.

Earlier this month YLE published a poll (fi) from Taloustutkimus. It also showed the Coalition losing some support, but the Centre gained there. Support for the government parties as a group was flat.

CP   NCP  SDP  LA  GL   CD  SPP TF  gov  source
23.1 22.3 21.4 8.8 8.5 4.9 4.6 4.1 58.5 PE 3/18
23.0 24.1 20.7 8.2 9.4 4.5 4.4 4.5 60.9 TT 4/5
22.8 23.3 21.1 8.4 8.9 4.5 4.3 4.9 59.3 SG 5/20
23.4 23.3 20.8 9.0 9.6 5.0 4.1 4.4 60.4 RI 5/25
22.4 23.4 21.7 8.4 10.1 4.7 4.1 4.3 60.0 TT 6/9
23.0 23.2 21.5 8.3 9.0 4.3 4.2 5.0 59.4 SG 6/26
22.8 23.9 21.2 8.5 9.3 4.7 4.4 4.3 60.4 TT 7/2
22.3 23.6 21.2 8.5 9.4 4.6 4.5 4.7 59.8 TT 8/13
22.7 23.2 21.6 8.1 9.4 4.7 4.5 4.6 59.8 TT 9/9
22.5 22.6 21.5 8.4 9.0 4.6 4.6 5.0 58.7 SG 9/22

Legend:
CP = Centre Party
NCP = National Coalition Party
SDP = Social Democratic Party
LA = Left Alliance
GL = Green League
CD = Christian Democrats
SPP = Swedish People's Party
TF = True Finns
gov = government parties
PE = parliamentary election
TT = Taloustutkimus / YLE
SG = Suomen Gallup (TNS-Gallup) / Helsingin Sanomat
RI = Research International Finland / MTV3

2007-08-18

Let's vote on it

Finland hasn't experienced many referendums, but that may be about to change:

Tuija Brax (green), Finland's justice minister, was quoted as saying by Helsingin Sanomat on Friday that referendums and popular initiatives could be used to persuade people to get more involved in society.

The minister told the paper she did not want to comment on what sorts of issues referendums could be held in the future.

The article mentions that a consultative referendum on NATO membership is thought to have support in the Parliament. I rather doubt we'll ever have one, though. A referendum is unlikely unless the government is in favor of membership and if the government is in favor of membership, it has no incentive to hold a vote that very well might go the other way. Similarly, a referendum on the EU not-a-constitution is highly unlikely, because there's a danger the people will vote the wrong way. What I'm getting at is that unless there's a good chance that a vote will be held even when the government-backed option might lose, there's no point in holding a vote.

2007-08-17

US presidential election test

Here's an election test on US presidential candidates (link spotted at Lawyers, Guns and Money). It's not quite as sophisticated as some of its Finnish equivalents and the approach of picking quotes from the candidates isn't the best way of going about things. I naturally took it anyway.

Not being an American, I steered clear of the purely domestic topics. Based on the topics "Environment and Energy", "Foreign Policy (General)", "Iran", "Iraq War", "Israel and Palestine", "Trade and Globalization", and "War on Terror and Homeland Security", the candidates scored as follows:

14 Bill Richardson (D)
13 John Edwards (D)
= Barack Obama (D)
12 Joe Biden (D)
= Christopher Dodd (D)
= Mike Gravel (D)
= Ron Paul (R)
10 John McCain (R)
9 Hillary Clinton (D)
8 Dennis Kucinich (D)
5 Sam Brownback (R)
= Mike Huckabee (R)
4 Mitt Romney (R)
3 Rudy Giuliani (R)
= Fred Thompson (R)
2 Duncan Hunter (R)
1 Tom Tancredo (R)

That's fairly close to what I had in mind prior to taking the test, although I could certainly quibble about some of the rankings. For example, if one could express particularly strong disapproval, McCain's stock would plummet due to his position on Iraq.

2007-08-14

Poll: Coalition 23.6, Centre 22.3, Soc Dems 21.2

The latest Taloustutkimus poll (fi) shows little change in party support. The Centre Party are down 0.5 percentage points to 22.3 percent and the True Finns are up 0.4 percentage points to 4.7 percent. The only change in the order of things is that the True Finns have now passed the Christian Democrats and the Swedish People's Party to go sixth. Support for the government is down a little, but it's still higher than in the election.

CP   NCP  SDP  LA  GL   CD  SPP TF  gov  source
23.1 22.3 21.4 8.8 8.5 4.9 4.6 4.1 58.5 PE 3/18
23.0 24.1 20.7 8.2 9.4 4.5 4.4 4.5 60.9 TT 4/5
22.8 23.3 21.1 8.4 8.9 4.5 4.3 4.9 59.3 SG 5/20
23.4 23.3 20.8 9.0 9.6 5.0 4.1 4.4 60.4 RI 5/25
22.4 23.4 21.7 8.4 10.1 4.7 4.1 4.3 60.0 TT 6/9
23.0 23.2 21.5 8.3 9.0 4.3 4.2 5.0 59.4 SG 6/26
22.8 23.9 21.2 8.5 9.3 4.7 4.4 4.3 60.4 TT 7/2
22.3 23.6 21.2 8.5 9.4 4.6 4.5 4.7 59.8 TT 8/13

Legend:
CP = Centre Party
NCP = National Coalition Party
SDP = Social Democratic Party
LA = Left Alliance
GL = Green League
CD = Christian Democrats
SPP = Swedish People's Party
TF = True Finns
gov = government parties
PE = parliamentary election
TT = Taloustutkimus / YLE
SG = Suomen Gallup (TNS-Gallup) / Helsingin Sanomat
RI = Research International Finland / MTV3

2007-08-05

Sámi parliamentary election coming up

Sámedig it:

Forty-five candidates are running for seats in the 21-member body, slightly more than in the last election four years ago. Voting begins in early September and ends a month later. There are more than 5300 eligible voters.

The Sámi Parliament (or Sámediggi) was established in 1996 to oversee Sámi cultural autonomy, which is guaranteed by the Finnish constitution. It cooperates with corresponding bodies in neighbouring Norway and Sweden.

I've been poking around the official Sámi Parliament website (fi). I have to say that this picture of the current crop of Sámi representatives shows that our MPs with their boring suits can't compete in the fashion department.

The election system is a bit unusual: The candidates that get the most votes are elected, with the provision that there needs to be at least three representatives from each of the three Sámi home municipalities. As far as I can tell there are no official political parties, which is a shame, because I bet Sámi parties would be awesome.

2007-08-03

Rise of the election machines

No, this post isn't about the dangers of electronic voting. TSN Gallup has conducted a poll on the use of election machines - i.e. online surveys that ask you various political questions and then recommend candidates and/or parties. Helsingin Sanomat reports on it here (fi) and Verkkouutiset offers more data.

About a third of people eligible to vote used election machines. That's up from about a quarter in 2003. 71 percent of election machine users voted. I wonder, does that mean that a sizable chunk of the rest would have voted if online voting had been possible? Overall the turnout was 68 percent. If my math is correct, roughly 35% of voters used election machines.

For their users election machines were the most important way of acquiring information about the election, narrowly beating TV news programs and newspaper articles. Lest you despair, users followed the election more closely than non-users using other information sources, too. For the population as a whole, election machines tied for third with election-related TV programs. They were behind news programs and newspaper articles, but ahead of candidate web sites, real life acquaintances, election ads in newspapers, and radio.

Interestingly, Internet forums - the category under which blogs are counted, at a guess - were the most important source of information for a big fat zero percent of voters in general. Among election machine users, three percent considered Interent forums as their most important information source. I think it's safe to say that at the moment Finnish political blogs are not a force with which anyone needs to reckon.

15 percent of users wound up voting for the candidate recommended by an election machine because they didn't have a favorite of their own. Three percent switched from a previous favorite candidate to a recommended candidate. An election machine helped one in five users to exclude a candidate. 53 percent of users voted for a candidate that no election machine had recommended. By my count roughly six percent of voters took their cues from an election machine.

I find it a bit odd that 47 percent of users voted for a candidate that was recommended to them by an election machine, but relatively few admit to following the recommendations. In my experience the candidate for whom I'm thinking about voting is almost never recommended to me as the top choice. Perhaps I know less about candidates' issue positions than the average user, but I suspect that respondents aren't being entirely honest about how important election machines were in their voting decisions.

I'm one of the people who used election machines to exclude candidates and I found that they work pretty well for that purpose. I also checked out a few candidates who I would have otherwise ignored. If memory serves, the candidate I voted for ranked high in at least one list of recommendations, but not at number one.

Users were more likely than other voters to opt for the National Coalition Party (31% versus 22%) and the Green League (17% versus 8%). The Centre Party (17% versus 23%) and the Social Democratic Party (12% versus 21%) were less popular among users than non-users. Presumably this is due to Coalitionists and Greens being more plentiful online than among the general populace.

The most popular election machines belonged to YLE (fi), MTV3 (fi), and Helsingin Sanomat (fi), in that order.

2007-07-03

Everybody loves Tarja

According to a recent Suomen Gallup poll, 84 percent of Finns give (fi) President Tarja Halonen (Social Democratic Party) a very good or a quite good grade. The main difference in the past six months is that National Coalition Party supporters have grown less happy with the way she handles foreign policy.

I wonder, to what extent are Halonen's ratings and the high ratings of Prime Minister Matti Vanhanen about their performance in office. If we replaced Halonen with the corpse of Lauri Kristian Relander, would the ratings remain as high? While the support for Halonen and Vanhanen is broad, election results suggest that it isn't very deep. When given alternatives, many of the people who say Halonen and Vanhanen are doing their jobs well voted for someone else. Before the election people expressed confidence in the centre-left government and hoped that the next government was based on the Centre Party and the Social Democratic Party. After the election, they expressed confidence in the centre-right government and considerd a coalition of the Centre and the National Coalition Party to offer the best basis for a government. Approval and support are two different things.

In other polling news, the latest Taloustutkimus poll (fi) is out. There aren't any big changes in it. The Centre and the Coalition gain a little; the Social Democrats lose some support; but it's all within the margin of error. Here's the table:

CP   NCP  SDP  LA  GL   CD  SPP TF  gov  source
23.1 22.3 21.4 8.8 8.5 4.9 4.6 4.1 58.5 PE 3/18
23.0 24.1 20.7 8.2 9.4 4.5 4.4 4.5 60.9 TT 4/5
22.8 23.3 21.1 8.4 8.9 4.5 4.3 4.9 59.3 SG 5/20
23.4 23.3 20.8 9.0 9.6 5.0 4.1 4.4 60.4 RI 5/25
22.4 23.4 21.7 8.4 10.1 4.7 4.1 4.3 60.0 TT 6/9
23.0 23.2 21.5 8.3 9.0 4.3 4.2 5.0 59.4 SG 6/26
22.8 23.9 21.2 8.5 9.3 4.7 4.4 4.3 60.4 TT 7/2
Legend:
CP = Centre Party
NCP = National Coalition Party
SDP = Social Democratic Party
LA = Left Alliance
GL = Green League
CD = Christian Democrats
SPP = Swedish People's Party
TF = True Finns
gov = government parties
PE = parliamentary election
TT = Taloustutkimus / YLE
SG = Suomen Gallup (TNS-Gallup) / Helsingin Sanomat
RI = Research International Finland / MTV3

2007-07-01

Government priorities and ratings

Earlier this week Helsingin Sanomat published a poll (fi) asking what are the most important goals for the new government. Below are the percentages of respondents who found the goal either the most important or the second most important.

  1. securing welfare services 49 (most important 31 + second most important 18)
  2. reducing poverty and social inequality 38 (22 + 16)
  3. restraining climate change and environmental protection 28 (12 + 18)
  4. preparing for the population's aging 28 (11 + 17)
  5. fighting unemployment 25 (11 + 14)
  6. lowering taxes 15 (7 + 8)
  7. taking care of national defense capability 6 (2 + 4)
  8. fighting crime and terrorism 5 (1 + 4)
  9. can't say 4 (2 + 2)
  10. something else 3 (2 + 1)

I've written this before, but it bears repeating: the election result should not be taken as a green light from the electorate to dismantle the welfare state. Such moves would not be received well, in all likelihood. (On that note, Jacob Christensen wrote a series of posts on the "instant failure" of the centre-right government in Sweden that can serve as a warning example: part 1, part 2, and part 3.)

So far the public seems reasonably pleased with what they're getting. In the same poll respondents were asked to grade parties and Prime Minister Matti Vanhanen (Centre Party). Here are the percentages of respondents who thought the entity had succeeded either quite well or very well in its tasks.

  1. Matti Vanhanen 82 (very well 18 + quite well 64)
  2. government 69 (5 + 64)
  3. Centre Party 64 (5 + 59)
  4. National Coalition Party 61 (7 + 54)
  5. Green League 48 (3 + 45)
  6. Swedish People's Party 46 (2 + 44)
  7. True Finns 43 (6 + 37)
  8. Social Democratic Party 37 (3 + 34)
  9. Christian Democrats 35 (2 + 33)
  10. Left Alliance 27 (1 + 26)

Conclusion: while Vanhanen is significantly more popular than the government he leads, the government is popular enough that opposition parties consistently rank below government parties in approval.